Timing the stock market: can you easily time the markets?
I’ll be brief. No. You can’t. Don’t try.
The old saying “buy low, sell high” is the fundamental of investing. Even Homer Simpson knows that!
However, timing the market to identify the lows and the highs is exceptionally difficult.
Buy and hold
For all of our analysis, we will use the FTSE 250 index, ignoring dividends:
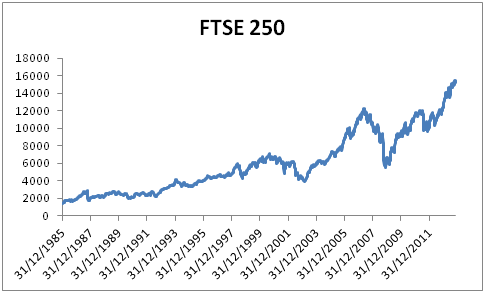
Let’s imagine we invested £10,000 in 1985 when my FTSE 250 data begins. Annual returns are 8.8% per annum, meaning your money would be worth £105,212 today.
Timing the market
We will attempt to “time the market”. Buy low, sell high remember!
To do this, we will buy £10,000 at day 1. Then we will sell every time we are invested in the market and the market reaches X% above its all time highs. We will re-buy every time the market is Y% below this previous high.
When the funds are not invested in the FTSE, they will be invested in cash at the average bank interest rate taken from the BoE data for that month. Note that the annual average return over the years on cash is 6.2%.
Remember, we need to beat an annual return of 8.8% per annum, returning over £105,212 today.
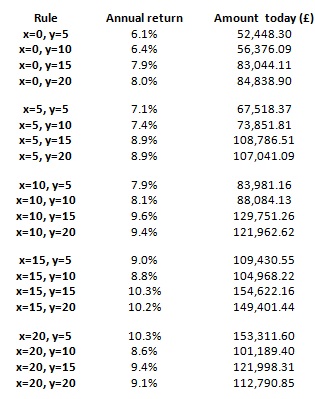
Depending on how we try to time the market, our returns could be anywhere between 2.7% less or 1.5% more than the long term buy and hold strategy.
So it looks like we can time the market?
Not really.
Yes, if we choose the x=15, y = 15 option, this provides an annual return which is 1.5% per year higher than the long term buy and hold. This doesn’t seem like much, but we can see that our returns could be almost £50,000 higher in this time frame by selecting the optimal approach.
Whilst we may be intrigued by the options that provide a greater than market return, we need to also consider the following:
- Although the decision making only uses historic data, the choice of the best return is hand-picked. If we started again today, we do not know exactly the optimal X and Y to select. Therefore, a more realistic comparison may be to look at the average of the best 10 returns (half the sample) as the benchmark for “timing the market”. This provides a return of 9.5% per annum (against the buy and hold strategy of 8.8% per annum).
- This analysis also ignores transaction costs. In the optimal scenario (x=15, y=15), we buy and sell 6 times over the period. This will mean that we incur transaction fees and bid-offer spreads 12 times over the period, thereby reducing our real return. This reduces 0.1% of our annual return.
- Tax. This is a big one. If we invest the £10k, we can do so via a stocks & shares ISA, and the capital gains will be tax free. The buy-and-sell strategy assumes that we have our money in cash when we are out of the market (returns would be significantly less without this assumption). However, for this to be the case, we would need to withdraw the cash from our stock & shares ISA, and deposit it elsewhere. When we come to reinvest, not all the amount could be placed in the ISA as it would exceed the annual deposit limit. This reduces our returns by around 1% per year.
- Dividends. This analysis ignores dividend payments. Let’s assume FTSE 250 dividend payments are 2% per annum. In the x=15, y=15 strategy, we are out of the market for 101 of the 337 months. Therefore, we are missing out on dividends worth 0.6% each year.
In summary, our revised return with “timing the market” is around 7.8%, which would cost us £20,000 over this time frame.
There is only one winner!
And, it’s great news! Not often does this happen in life, but the best thing you can do is to be lazy.
This generally agrees with the conclusions noted in the best time to invest in the stock market best time to invest in the stock market” article. However, as explained in this article, there may times in extreme volatility when it could be worthwhile to take an action.
Do you try to time the market? If so, what other indicators do you use?
Are you worried about the stock market currently “overheating”?
Every week I pay off that weeks charges to the credit card (groceries, gas and any automatically billed items like insurance, cellular, etc. I confirm the pay has been deposited if it’s a pay week. Then I assess how much excess is in the account that isn’t required for the following weeks – I lay our our income and planned spending a year in advance so scrolling down the spreadsheet to “see into the future” is simple. If the markets are having a “sale” I transfer all the excess into our retirement accounts (rebalancing our prefered investment mix in the process). If the markets are rocketing to the moon, then the excess all goes to an extra mortgage payment. The only exception to this pattern was during the spectacular sale the markets held in 2008/9. I made virtually no extra mortgage payments from August 2008 for about 8 months, and instead scooped up some great deals on the market. Once the market started tracking back to pre crash levels I went back to the normal routine of assessing the situation weekly.
Would it be possible to disclose your annual returns? During 2013 and during 2008/2009?
We don’t make any attempts to time the market as that always felt like a losing proposition.
I always thought the market was something difficult to learn but then there are those who are successful in it. I wonder if there really is timing it.