Have you ever wondered how you are doing financially compared to others? Answering the question “how wealthy am I?” is a very personal affair, but sometimes it’s good to have some comparisons to determine how well you are doing compared to others around you.
Today, we have a look at some Office of National Statistics data from the last census regarding household net worth across the whole of the UK. We are also going to look a little into regional trends when these show something of interest. The source data to answer the question “how wealthy am I?” was taken from:
Related Data: Personal Finance Data (ONS)
How Wealthy Am I – Total Household Net Worth
The first, and most important, metric we are going to look at in determining how wealthy you are is the total net worth of each household.
This is calculated as being the total assets less total liabilities of every member of the household combined. The results are as follows:
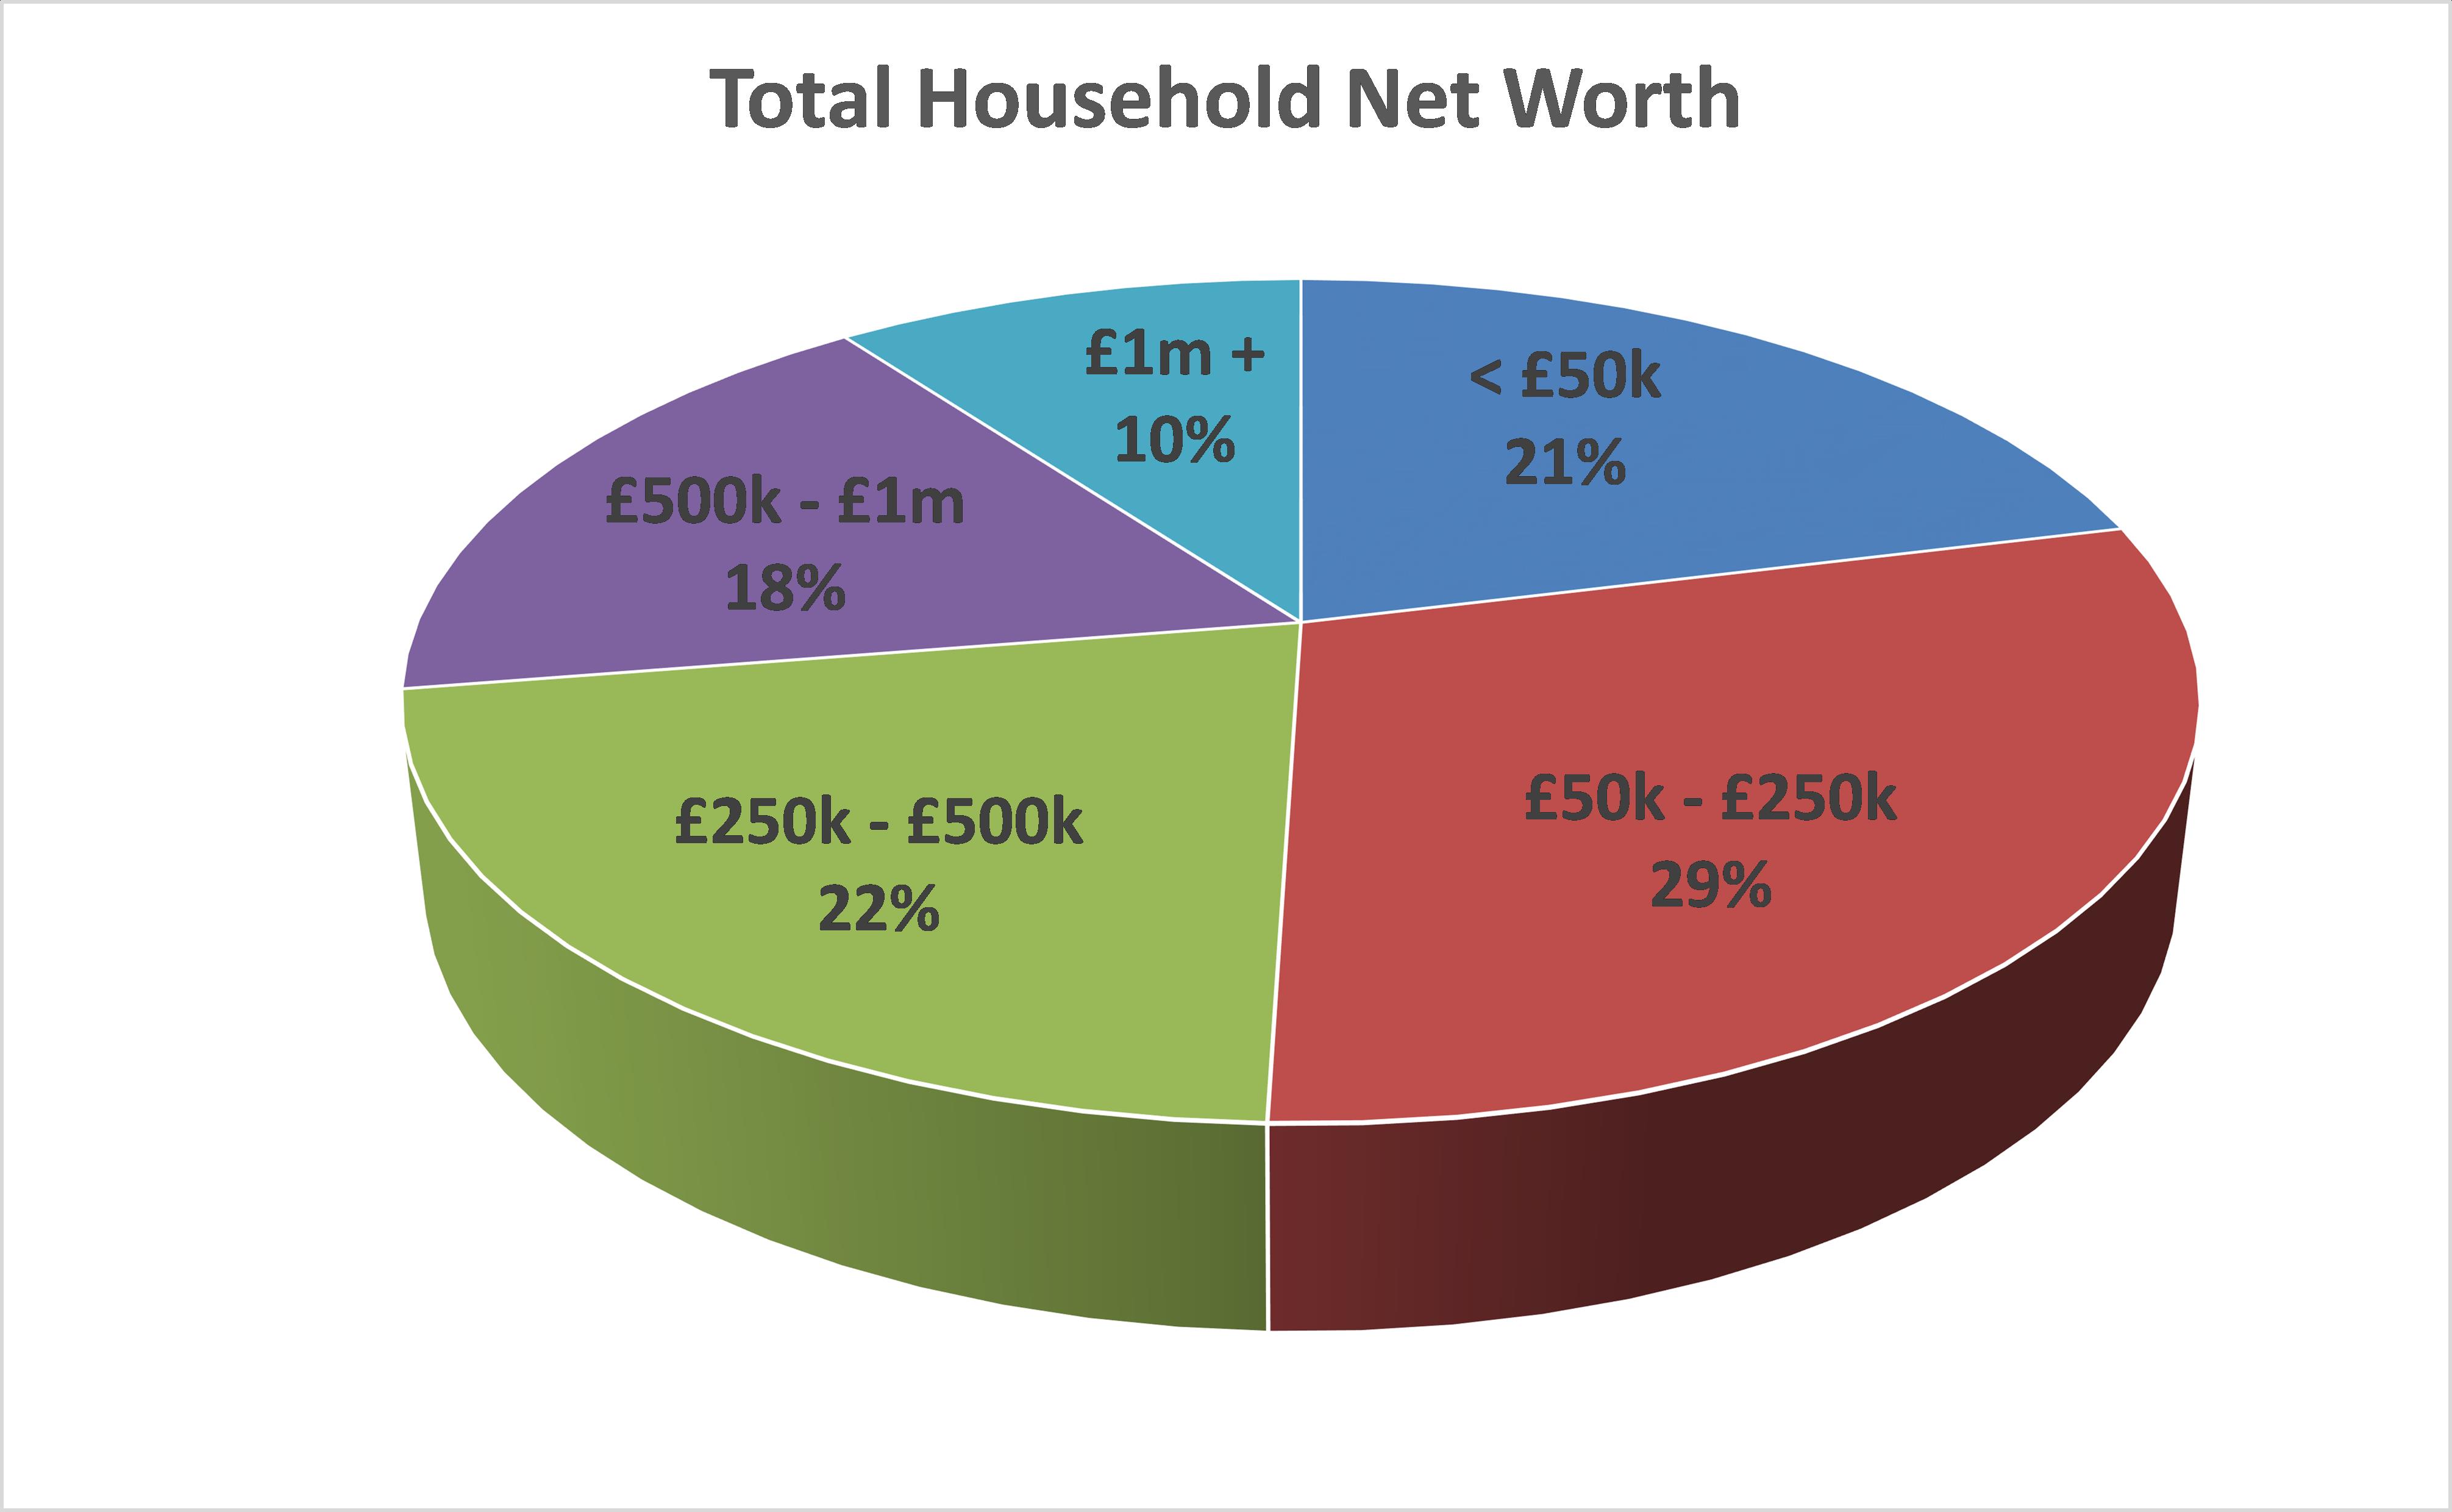
From, this the following key points hit me:
- Over 10% of UK households have a household net worth of over £1m. Put another way: 1 in 10 households are millionaires! I was surprised at how high this figure is.
- Over 21% of UK households have a household net worth of less than £50k. This is less surprising, but much more worrying.
When it comes to net worth, there are some interest regional variances:
- London has both the highest % of households with a net worth of under £50k (28%) AND the highest % of household with a net worth of over £1m (12%).
- The “North-East” is the country’s poorest region, with 28% of households under £50k, but only 8% of households with a net worth over £1m.
- The “South-East” is the country’s most “equal” region, with only 15% of households under £50k, and with a whopping 15% of millionaire households.
So, from this data you can see which section you fall into. If you do not already know your household net worth, I would recommend that you download the free spreadsheet as part of the Moneystepper Savings Challenge, where you can easily enter your own information to determine your household’s net worth.
Related Data: Moneystepper Savings Challenge – Net Worth Calculator
Interesting stuff. However, you shouldn’t just stop there. It’s important to know how you compare to others in the UK in specific “wealth categories”. For anyone who has read Kiyosaki’s Rich Dad Poor Dad will know, a household net worth made up of appreciating assets (investment property, trade stocks & shares, etc) is much different from the same net worth value made up of expensive depreciating assets (cars, boats, jewelry, etc).
So, let’s dive down into the next level and split this total net worth into certain areas. But, before we do, you might be interested to remember how wealthy we all are (especially in the Western World) compared to all other times in history:
How Wealthy Am I – Property Wealth
The next category is the total amount of total equity each household has in property. Equity is defined as the value of all properties (own home, rentals, holiday homes, etc) less the current balances of all mortgages or other loans secured on the property.

Again, my key takeaway points are:
- A relatively low number of households are actually in “negative equity”. After the housing crash on 2008 and the very high LTV mortgages being offered, many people found that their loans and mortgages exceeded their home value. However, it would seem that this has now been corrected as only 1% of households find themselves in this situation.
- The largest group (31%) is the £100k – £250k band. I’m impressed that almost a third of people have home equity of at least £100k. But, is this unusual? Say we bought the average house in the UK in 2004, this would have been worth £140k. With a 75% LTV mortgage taken over 25 years, our current outstanding mortgage balance today would be £75k. According to the Nationwide HPI, the house value on the other hand would be £190k. Therefore, this average buyer from 10 years ago would have equity of £115k today and hence would be in this category. Therefore, maybe we shouldn’t be surprised that this is the norm.
- 4% have household equity of over £500,000. Again, I find it impressive that 1 in 25 people have household equity (repeat – not just house value) of more than half a million pounds.
- 28% of people do not have any property wealth at all. This means that they are renting their own property. Is this number high or low? It’s tough to say. This number is a little higher in the US, and as high as 60% in Germany, where renting is much more considered the norm.
As for the regional analysis:
- It won’t be a shock that there is a big gap in property wealth between London and other regions. For example, 8% of households in London have property wealth of over £500k, whereas this figure is only 2% for the North-East, North-West, Yorkshire, East Midlands, Wales and Scotland.
-
Related Article: London vs The Rest Of The UK (Moneystepper)
- The South-East only has 23% of households with a £0 property wealth, whereas the North-East percentage stands at 33%, and London tops the charts with 37%. This probably shows how many people rent rather than own in London due to inflated house prices and difficulty getting on the property ladder.
How Wealthy Am I – Pension Wealth
Next stop, the exciting topic of pensions. Woo-hoo!
This was probably the most surprising category and I had only one very key observation:
- A huge 23% of people have nothing saved in a pension!
This is not good! Any readers of moneystepper will know how important we think pensions are – especially when you have matched pensions by your employer. For example, we proved how much value you might be losing by taking advice of paying down high interest debt compared to saving with an employer matched pension.
Related Article: Pay Down Debt Or Save For Retirement (Moneystepper)
The maximum basic state pension is currently £113 per week, or less than £6,000 per year. This clearly isn’t enough to live a comfortable retirement. Pension saving is important. Does anyone have a contact address for this 23% of households so that I can let them know?!
Also:
- In the 45-64 age bracket for the whole UK, 43% of people have less than £100k in their pension.
I’d like to run an example to show you why I think that most people could, and should, have more than £100k in their pension by the age of 55.
Say that, from the age of 25 to 55, our employer matches our pension contribution and that this grows at 7% per annum (possible if invested in long-term market tracking ETFs with low fees). To get to £100k at the age of 55, we only need to contribute £494 a year to our pensions. This is only equal to around 1% of the average annual household income.
Can you afford that? Of course you can. It means you have to contribute £41 per month, £9,50 per week or £1.30 per day. I’m sure there are a lot of things that you are wasting £1.30 per day on that you could instead be contributing to your pension.

The regional analysis also throws us something very surprising:
- The region with the highest percentage of people with £0 in pensions (29%) is…LONDON! London also has the lowest percentage of people with over £500k in pensions (8%). This comes as a very big surprise to me and, quite frankly, I have no idea why. Has anyone got any ideas? I’d love to hear them in the comments below.
How Wealthy Am I – Financial wealth
This then leaves us with financial household wealth – how much does each household have in cash, savings and investments less the amounts they have in loans or debts:

After pensions, this is probably the most surprising of the categories:
- Outside of property and pensions, 27% of households have outstanding (non-mortgage) debts which exceeds the value of their cash, savings and investments. Of these, 8% have debts of over £10,000! Not great.
- Only around one third of people (35%) have positive financial wealth of over £20,000. Therefore, I don’t think that many people are using the new ISA limits of £15,000 per year!
In the regions:
- In the North-East, over 35% people (against the national average of 27%) have a negative financial worth.
- The lowest percentage of people with negative financial worth is in Scotland with only 22%.
- 18% of South-East households have financial wealth of over £100k (compared to the national average of 12%).
How Wealthy Am I – Total Data Analysis
I don’t know if you’ve picked up on this, but for me there’s something missing here…
Consider the following equation:
Total net worth = Property wealth + Pension wealth + Financial wealth ± Others
For each part of the equation, I am going to estimate how much the median household has to determine the “other”. Therefore, the formula above for the median households (estimated by interpolating the ranges in the data) would be:
£250,000 = £92,000 + £60,000 + £14,000 ± Others
This means that the average total net worth includes “others” of over £80k, not held in property, pensions, cash, savings or investments.
So, where is all this “net worth”?
Well, it is in physical wealth.
This divides opinion. Many people consider this as part of their net worth as they could sell all their belongings if they needed to and hence they have a value.
I’m on the other side of the fence.
Whilst you could sell all these items, you aren’t ever going to. Even if you did, you would probably end up replacing them but something of equal, or even higher, value.
Also, these physical positions do not generate any future wealth. Therefore, in the moneystepper definition of assets, they should not be included. At best (DVD collections, ornaments, clothes, jewellery, etc) they are just stuff. And, why do we need so much stuff? At worse (expensive cars, boats, etc) they are actually liabilities as they will generate future expenses.
Related Article: Why Do We Need So Much Stuff (LifeHack)
What does this do for the total household wealth in the first section?
Well, if we removed this £80k from each category, our new pie chart would look something like this…
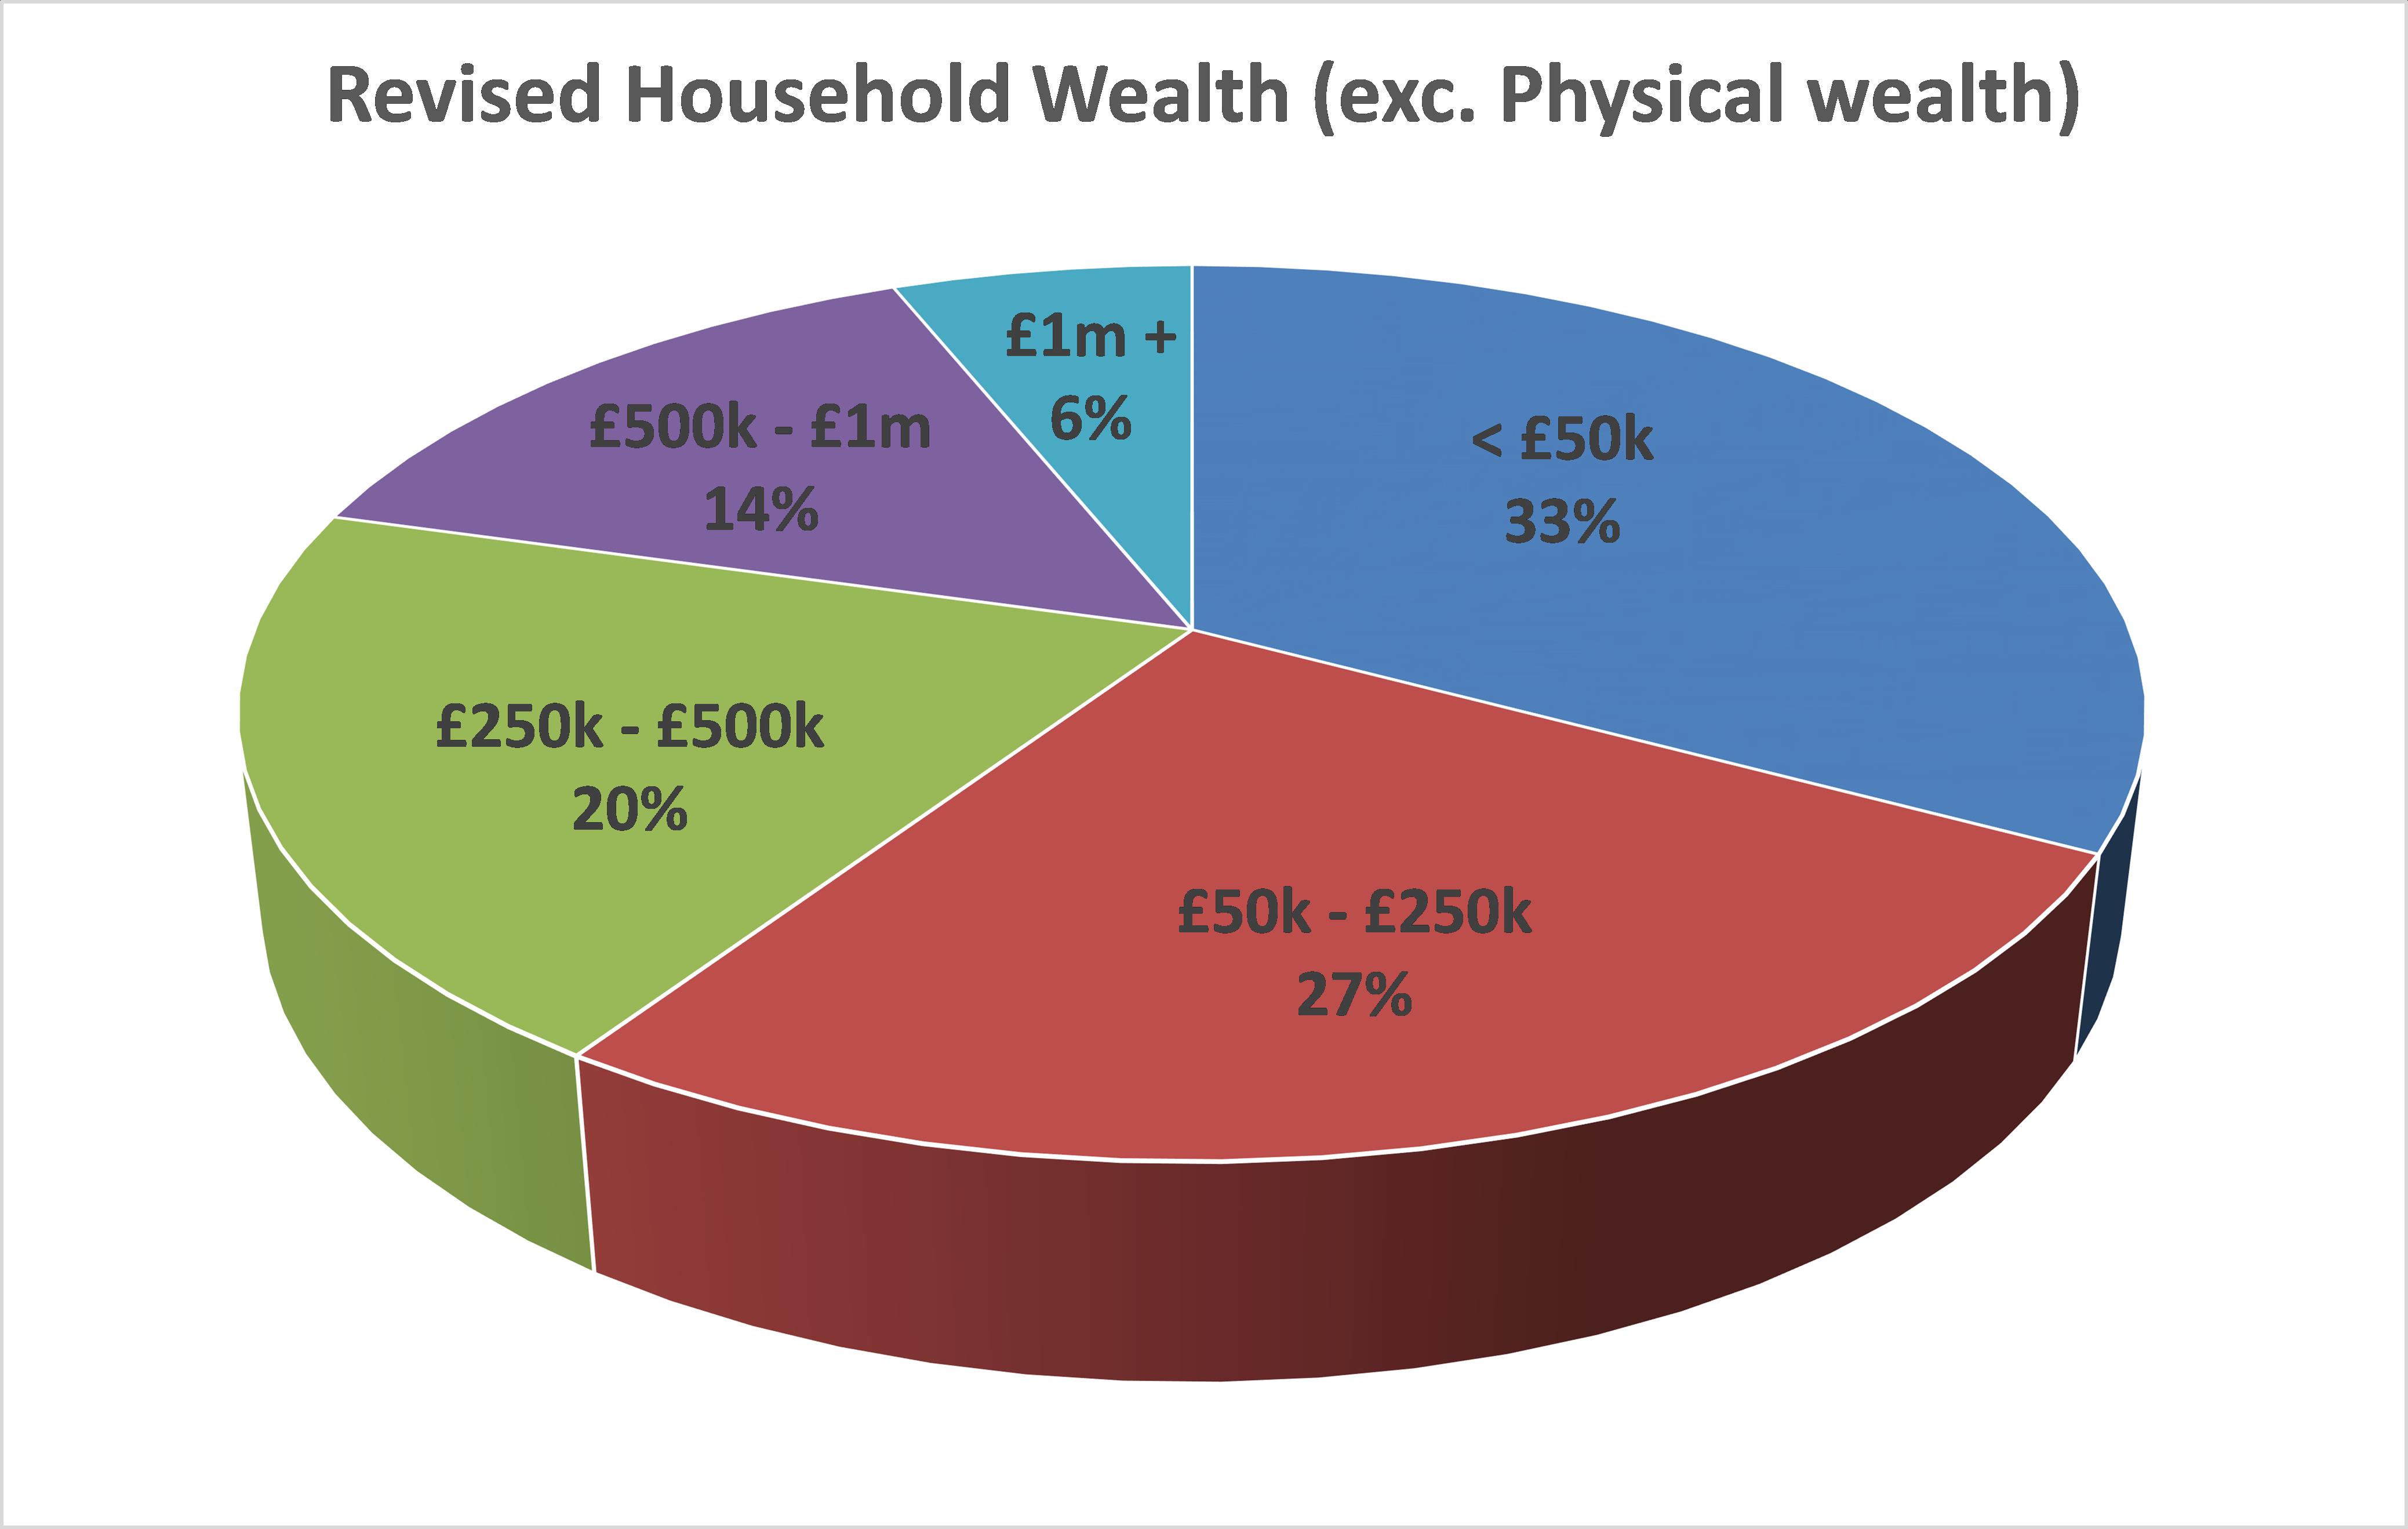 A lot more people now with less than £50k in what we would consider real net worth here at moneystepper.
So, does that help you answer the question: how wealthy am I? Are you surprised by these wealth bands? Do you think physical possessions should be included in your net worth?
I found this fascinating. I watch a lot of British documentaires and it’s been fun learning about what goes on over there. I’d love to see a breakdown like this for Americans. I’m betting the percentages aren’t that much different than yours.
I would think that they are very similar. Might be interesting to see a similar analysis by state (or by major city) in the US. I guess the difference is that the UK only really has one MAJOR city in London, whereas the US has several.
That is a good analysis on how wealthy a person can be in UK. The computation is showing good results and is to follow. Actually, I am a bit shocked that I am below the average. And, I believe that physical possessions be included to be in a higher rank.
I guess there are two things to consider which this analysis doesn’t consider (as I didn’t want the article to be a million words long):
1) Your age – these values vary greatly by age group and so you have to take this into account when considering how wealthy you are
2) Your possessions – as you say, these top numbers include everything – sofas, coffee table, kitchen utensils, the lot. I think when you add all of those things in, you’ll magically see your number pop up. That’s why I personally don’t think these figures should have material possessions included.
This is my favorite kind of article. We’re told we shouldn’t compare ourselves to others, but everything is relative, so we have no way to measure how we’re doing unless we use some sort of benchmark. Sometimes you just gotta do it!
Agreed. Everything in personal finance is relative, and “other people” is one good indicator (although maybe not the primary indicator) to determine how wealthy you are. Thanks for your comment Mark.
It is always interesting to see where we ‘stack up’ in comparison to others. I also would be interested in seeing the same type of statistics for us here, in the Ü.S. my hubby does a yearly analysis and uses our possessions in the equation.
Hi Jayleen. Firstly, welcome to moneystepper and thank you for your comment!
I’m curious, where do your “possessions” stop in your calculation – i.e. what is the lowest value item that you include in your net worth?
Very interesting. The key issue is that wealth is a relative concept and age matters an awful lot in segmentation of wealth. A middle class 70 year old and his partner are perfectly likely to have household wealth in excess of £1M, or even £2M in many cases, whereas a 45 year old of similar background will most likely fall into the next lowest category or even the one lower than that one, while even a relatively well off 25 year old will probably fall into the <£50k category unless his palms have been considerably greased by parental assistance.
Great point Mark.
If you go to the link for the ONS data, they also have it split by age group.
Originally, I was going to include the age split data into the “how wealthy am i” analysis, but it made the article incredibly long and quite complex. However, if you are willing to explore the tables of data over at the ONS, you can work out the same comparison for your own specific age group.
Hi. I am 67 yrs old and have wealth which puts me in the top 6% of the population according to your article. This was achieved by building and selling a business. Like most people who have gained wealth I will now redistribute it by living a comfortable retirement and spending a sizeable chunk of that cash/assets. For those with less than me but younger surely the message is that national wealth is finite and it is for the individual to try to improve their “share”. The wealth is there it just needs redistributing! I think this is a more positive message for those less fortunate than me?
David